| blackbox/config | ||
| grafana | ||
| images | ||
| prometheus | ||
| .travis.yml | ||
| docker-compose.yml | ||
| Grafana-Org-Stats.json | ||
| README.md | ||
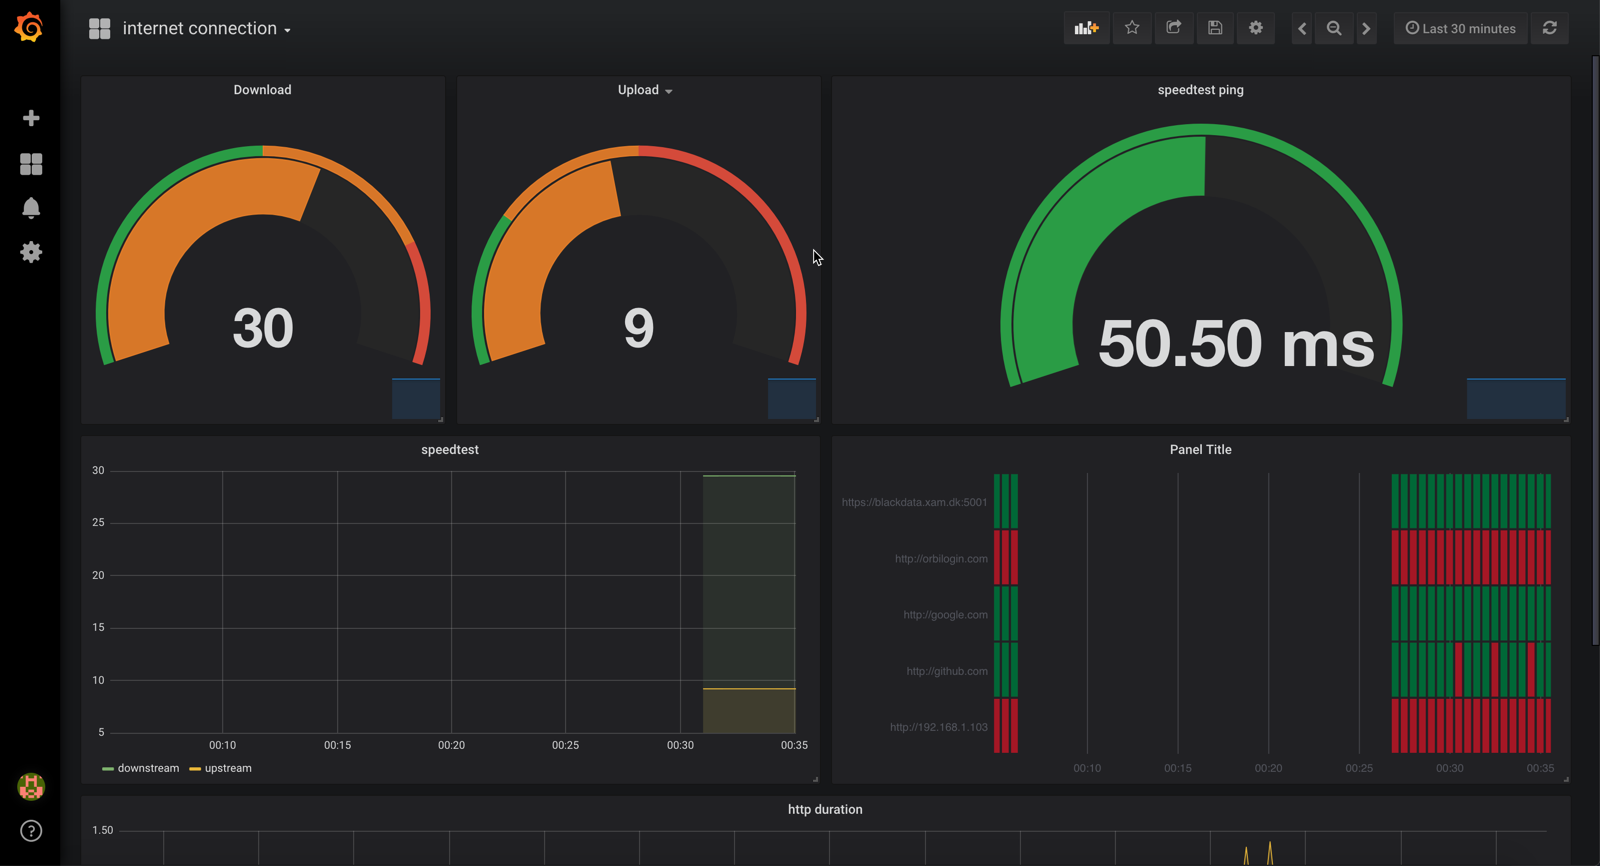
A Docker Stack which Monitors your home network
Here's a quick start to stand-up a Docker Prometheus stack containing Prometheus, Grafana with blackbox-exporter and speedtest-exporter to collect and graph home network connections and speed.
Pre-requisites
Before we get started installing the Prometheus stack. Ensure you install the latest version of docker and docker-compose on your Docker host machine. This has been tested with Docker for Mac and Synology and it works.
Quick Start
If on Mac run this:
git clone https://github.com/maxandersen/internet-monitoring && cd internet-monitoring/prometheus && docker-compose up && open http://localhost:3030/d/o9mIe_Aik/internet-connection
otherwise:
git clone https://github.com/maxandersen/internet-monitoring
cd internet-monitoring/prometheus
docker-compose up
Goto http://localhost:3030/d/o9mIe_Aik/internet-connection (change localhost to your docker host ip/name).
Configuration
To change what hosts you ping you change the targets section in /prometheus/pinghosts.yml file.
For speedtest the only relevant configuration is how often you want the check to happen. It is at 5 minutes by default which might be too much if you have limit on downloads. This is changed by editing scrape_interval under speedtest in /prometheus/prometheus.yml.
Once configurations are done let's start it up. From the /prometheus project directory run the following command:
$ docker-compose up -d
That's it. docker-compose builds the entire Grafana and Prometheus stack automagically.
The Grafana Dashboard is now accessible via: http://<Host IP Address>:3030 for example http://localhost:3030
username - admin
password - wonka (Password is stored in the config.monitoring env file)
The DataSource and Dashboard for Grafana are automatically provisioned.
If all works it should be available at http://localhost:3030/d/o9mIe_Aik/internet-connection - if no data shows up try change the timeduration to something smaller.
Interesting urls
Note: replace localhost with your docker host ip/name if not running this locally.
http://localhost:9090/targets shows status of monitored targets as seen from prometheus - in this case which hosts being pinged and speedtest. note: speedtest will take a while before it shows as UP as it takes ~30s to respond.
http://localhost:9090/graph?g0.expr=probe_http_status_code&g0.tab=1 shows prometheus value for probe_http_status_code for each host. You can edit/play with additional values. Useful to check everything is okey in prometheus (in case Grafana is not showing the data you expect).
http://localhost:9115 blackbox exporter endpoint. Lets you see what have failed/succeded.
http://localhost:9696/metrics speedtest exporter endpoint. Does take ~30 seconds to shohw its result as it runs an actual speedtest when requested.