3.2 KiB
A Docker Stack which Monitors your home network
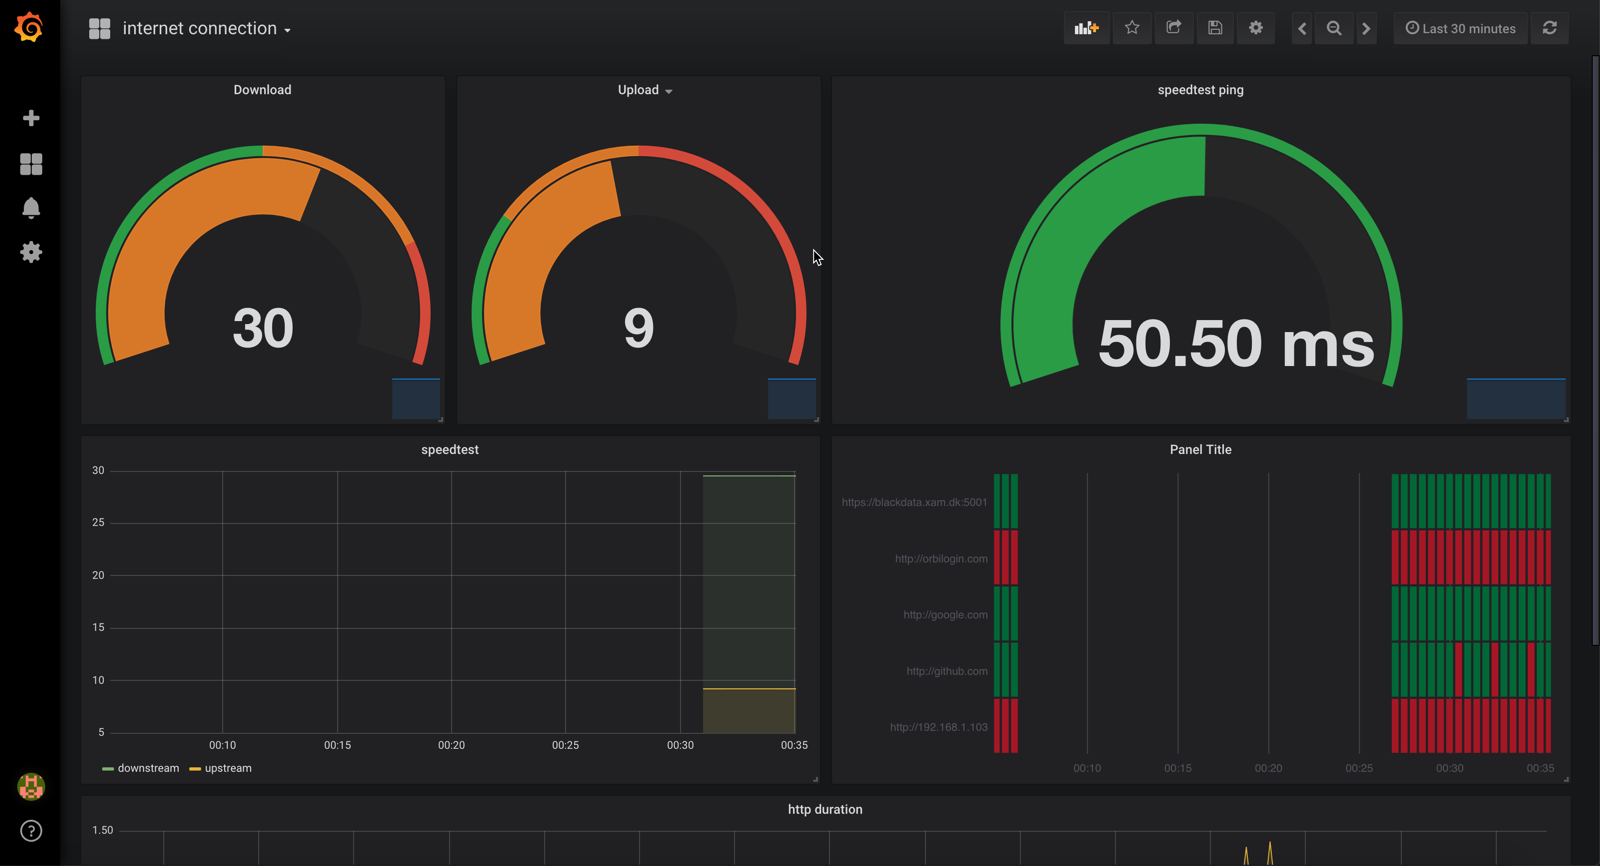
Here's a quick start to stand-up a Docker Prometheus stack containing Prometheus, Grafana with blackbox-exporter and speedtest-exporter to collect and graph home network connections and speed.
Pre-requisites
Before we get started installing the Prometheus stack. Ensure you install the latest version of docker and docker-compose on your Docker host machine. This has also been tested with Docker for Mac and it works well.
Installation
Clone the project to your Docker host.
If you would like to change which targets should be monitored or make configuration changes edit the /prometheus/prometheus.yml file. The targets section is where you define what should be monitored by Prometheus. The names defined in this file are actually sourced from the service name in the docker-compose file. If you wish to change names of the services you can add the "container_name" parameter in the docker-compose.yml file.
Configuration
To change what hosts you ping you change the targets section in /prometheus/pinghosts.yml file.
For speedtest the only relevant configuration is how often you want the check to happen. It is at 5 minutes by default which might be too much if you have limit on downloads. This is changed by editing scrape_interval under speedtest in /prometheus/prometheus.yml.
Once configurations are done let's start it up. From the /prometheus project directory run the following command:
$ docker-compose up -d
That's it. docker-compose builds the entire Grafana and Prometheus stack automagically.
The Grafana Dashboard is now accessible via: http://<Host IP Address>:3030 for example http://localhost:3030
username - admin
password - wonka (Password is stored in the config.monitoring env file)
The DataSource and Dashboard for Grafana are automatically provisioned.
If all works it should be available at http://localhost:3030/d/o9mIe_Aik/internet-connection - if no data shows up try change the timeduration to something smaller.
Interesting urls
Note: replace localhost with your docker host ip/name if not running this locally.
http://localhost:9090/targets shows status of monitored targets as seen from prometheus - in this case which hosts being pinged and speedtest. note: speedtest will take a while before it shows as UP as it takes ~30s to respond.
http://localhost:9090/graph?g0.expr=probe_http_status_code&g0.tab=1 shows prometheus value for probe_http_status_code for each host. You can edit/play with additional values. Useful to check everything is okey in prometheus (in case Grafana is not showing the data you expect).
http://localhost:9115 blackbox exporter endpoint. Lets you see what have failed/succeded.
http://localhost:9696/metrics speedtest exporter endpoint. Does take ~30 seconds to shohw its result as it runs an actual speedtest when requested.